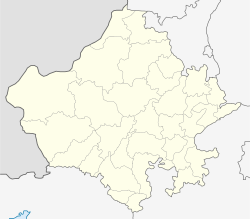
Horticulture crops occupy a relatively low proportion of gross cropped area in the district, diminishing the economic viability of solar pumps here. The district appears in the group of districts, which are (very) highly vulnerable towards climate change, as per an index constructed by CRIDA.
Deployment Approaches
| Approaches | Feasibility |
|---|---|
| Individually owned off-grid solar pumps | Limited Suitability |
| Solarisation of feeders | Limited Suitability |
| Solar based water as a service | Not Suitable |
| Promote 1 HP and sub-HP pumps | Not Suitable |
| Solarisation of individual grid-connected pumps | Limited suitability |
Individually owned off-grid solar pumps
Limited Suitability
The district has a relatively high disbursement of institutional credit and a comparatively high concentration of diesel pump users. However, ground water availability is below the safe limit, and crop revenue per holding is low, making it very difficult to promote the private ownership of solar pumps here.
| Parameter | Value | Percentile |
|---|---|---|
| Number of cultivators reporting use of diesel pumps | 68,261 | 82 |
| Water Availability Index | 0.39 | 30 |
| Crop revenue per holding (INR) | 51,785 | 35 |
| Medium and long term institutional credit disbursed in a year (in INR Crore) | 26.7 | 49 |
Solarisation of feeders
Limited Suitability
The district has a relatively high penetration of electric pumps, and its DISCOM incurs a high cost for supplying power, but the district has a comparatively low extent of feeder segregation. Solarisation of the feeders will only be possible once the district separates agricultural feeders from the rest.
| Parameter | Value | Percentile |
|---|---|---|
| Actual cost of power supply (INR/kWh) | 7.1 | 95 |
| Extent of feeder segregation | 19% | 33 |
| Proportion of cultivators reporting use of electric pumps | 20% | 69 |
Solar based water as a service
Not Suitable
The district has a relatively high proportion of unirrigated area. But, the concentration of small and marginal farmers is rather low and groundwater availability is below the safe limit, making it very difficult to promote solar-based irrigation through the water-as-a-service model here.
| Parameter | Value | Percentile |
|---|---|---|
| Water Availability Index | 0.39 | 30 |
| Proportion of small and marginal cultivators | 82% | 43 |
| Unirrigated net sown area as a share of total net sown area | 69% | 59 |
Promote 1 HP and sub-HP pumps
Not Suitable
The district has a comparatively high disbursement of institutional credit to marginal farmers. But, a rather low concentration of marginal farmers, a relatively low proportion of horticulture crops under gross cropped area, and groundwater availability below the safe limit make it extremely difficult to promote 1 HP and sub-HP pumps here.
| Parameter | Value | Percentile |
|---|---|---|
| Area under horticulture crops as a share of gross cropped area | 1% | 10 |
| Water Availability Index | 0.39 | 30 |
| Proportion of marginal cultivators | 59% | 43 |
| Medium and long term institutional credit disbursed in a year (in INR Crore) | 26.7 | 49 |
Solarisation of individual grid-connected pumps
Limited suitability
The district has a relatively high penetration of electric pumps and power supply to its agriculture consumers is heavily subsidised. But the district has a comparatively low extent of feeder segregation and its groundwater availability is below the safe limits. Solarisation of individual grid-connected pumps will only be possible once the district separates agricultural feeders from the rest. Further the approach should be taken up with extreme caution as it may aggrevate the groundwater depletion.
| Parameter | Value | Percentile |
|---|---|---|
| Water Availability Index | 0.39 | 30 |
| Actual cost of power supply (INR/kWh) | 7.1 | 95 |
| Extent of feeder segregation | 19% | 33 |
Leveraging Solar Pumps to Promote Policy Objectives
If you are deploying solar pumps in this district then you can further these policy objectives.
Har Khet ko Pani
A relatively high proportion of the net sown area in the district is unirrigated, indicating high irrigation demand. Solar pumps can help improve access to underground irrigation as part of Har Khet ko Pani.
| Parameter | Value | Percentile |
|---|---|---|
| Unirrigated net sown area as a share of total net sown area | 69% | 59 |
Doubling Farmers’ Income – Crop Intensity
A relatively high proportion of the district’s net sown area is unirrigated. Lack of access to irrigation is one of the major barriers to growing crops beyond two conventional seasons, rabi and kharif. Ensuring irrigation access through solar power will help improve cropping intensity and move towards the aim of doubling farmers’ income by 2022.
| Parameter | Value | Percentile |
|---|---|---|
| Unirrigated net sown area as a share of total net sown area | 69% | 59 |
Doubling Farmers’ Income – Crop Diversification
In the district, horticulture crops occupy a relatively low proportion of gross cropped area, indicating an opportunity for growing more high value non-staple crops. Solar-powered irrigation could be an alternative source of reliable irrigation, making it easier to achieve crop diversification and enhance farmers’ incomes.
| Parameter | Value | Percentile |
|---|---|---|
| Area under horticulture crops as a share of gross cropped area | 1% | 10 |


